Air quality is an inherently important aspect of both personal and environmental health. This is a problem that many Canadians struggle with due industries’ proximity to residential areas. This project focuses on two communities in Ontario, Aamjiwnaang and Sarnia, which are next door neighbours to Chemical Valley, Canada’s largest refinery of petrochemical products. Health effects on the community have been dire; girls are born at double the rate of boys, there is a high rate of asbestos related diseases, and about 40% of community members require an inhaler [1].
The First Nations community of Aamjiwnaang suffered the most due their immediate proximity to Chemical Valley. Aamjiwnaang residents started monitoring their own air quality after noticing numerous leaks that companies were slow to report to the public. The residents were trying to regain control of their air quality by taking air samples through a vacuum system and sending them to California at a cost of $500 per test and a two week wait [2]. After speaking with Aamjiwnaang’s community run environmental group as well as accessing reports from their stationary air quality monitoring system, it became apparent that there was a need for a mobile system and new connections with other air quality stations in the area. It also became apparent that existing data from these stations was being presented in an inaccessible way, through hard to read charts and graphs. These challenges needed to be addressed from a systems perspective and broken up into three main topics: data collection, data management, and data integration.
To address data collection, the ideation process started with quick sketches for data collection devices located everywhere from the outside of houses to individuals’ pockets. A wearable device became the forerunner for the final prototype for two reasons: the wearable nature allows for constant reading of surroundings, and the monitor also acts as a personal totem signifying the wearer’s inclusion in a bigger system and community movement. Since the device would be on constant display while the wearer went about their day, its form became a critical concern. Through sketching as well as foam and clay prototypes, the form took shape. This object needed to become part of someone’s daily routine: it had to be easy to use and easy to access or relocate when not in use or when changing outerwear. The body of the form is made out of smoked Birchwood and features a laser-cut with LED indicators underneath presenting a simplified version of the application interface. Preliminary research was done into creating or sourcing sensors to monitor gases. An American sensor company was contacted to determine what could and could not be monitored, and with what accuracy. A standalone sensor with feedback and computing capabilities would have made the wearable device too large, and so a smartphone was brought into the equation. The connection to a smartphone was needed for two reasons; firstly, it allowed for a more robust connection to other users in the system, and secondly, it allowed for the sensor’s size to shrink.
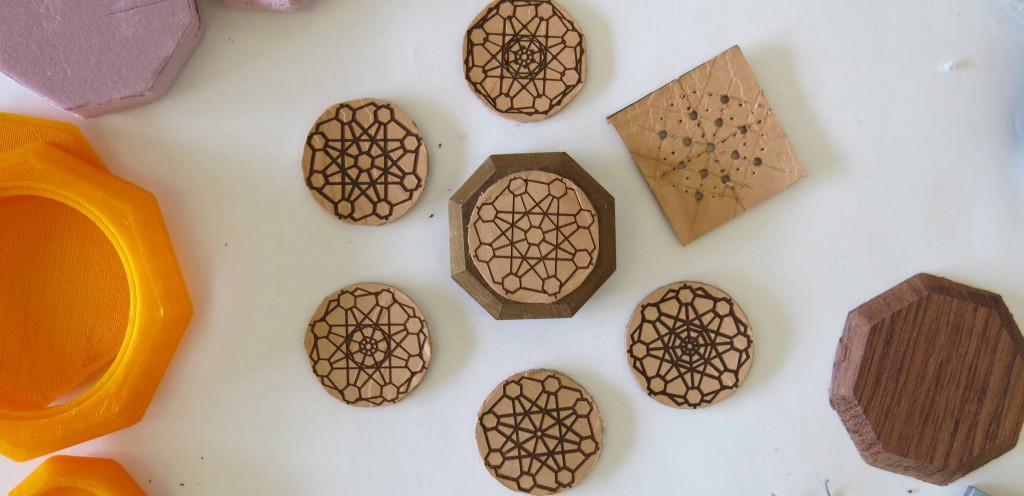
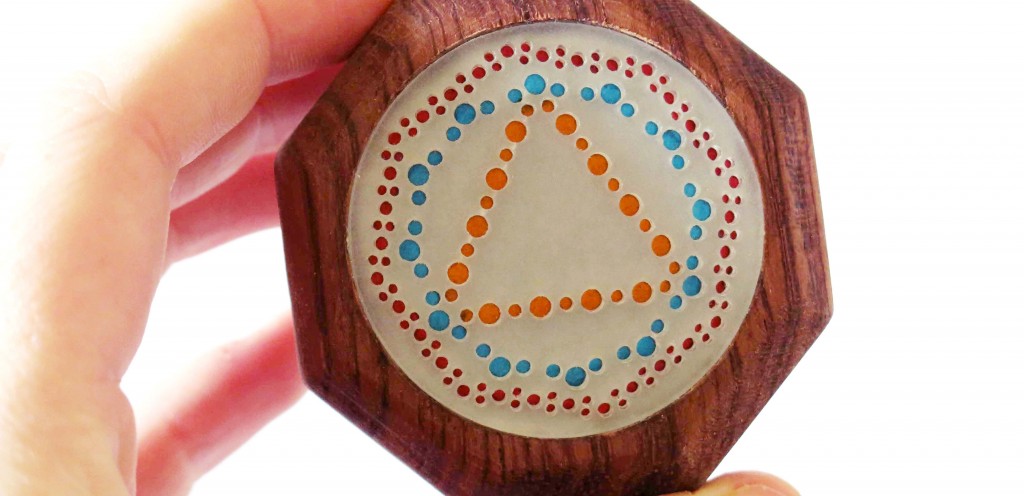
A mobile application was designed to manage and visualize the data collected through the wearable device, becoming the main interaction interface and data management portion of the system. Processing language was chosen for the mock-up because it handled the data well and could be quickly converted into an Android application. The application works in two modes: it has a home screen widget, which gives information to the user at a glance, as well as a more detailed secondary screen, which shows exposure to contaminants over a set period of time. To establish an appropriate visual language related to air, imagery from constellation maps and kaleidoscopes was used as inspiration and adapted to highlight the connective aspects of the system. The Workplace Hazardous Materials Information System and road signs symbols were also consulted to build off existing visual semiotic conventions. The data aggregates through individual users both receiving and sending air quality data into the system. Interaction is thus a two-way channel, with information from a personal sensor being pooled, analyzed, and then pushed out to other users in the area. Alerts of leaks and data from the large air monitoring station also reach individual users through their wearable devices. Based on the levels of contaminants in the air, the wearable lights up green for low, or yellow for moderate contamination. For urgent notifications of high contaminant values, the device would vibrate and light up red to alert the user. By having light and vibration built into the wearable device, the system isn’t relying on the connected phone’s built in notification system alone to notify the user of changes in the air quality.
The system is still in the early stages of testing. Over the upcoming months, both, the wearable and interactive aspects of this system, including interaction with the device and the application, will be refined through more user testing and further prototyping. Other aspects, like the working sensors and increased access to data need to be addressed, possibly drawing on other systems already in place. A plan for implementation needs to be worked out to allow this concept to become a reality, and to provide individuals with access the information needed to protect their health and the environment.
References
- [1] MacDonald, Elaine, and Sarah Rang. “Exposing Canada’s Chemical Valley an Investigation of Cumulative Air Pollution Emissions in the Sarnia, Ontario Area.” Ecojustice Report. <http://www.ecojustice.ca/publications/reports/report-exposing-canadas-chemical-valley/attachment>. 21 Jan. 2014.
- [2] McGuire, Patrick. “I Left My Lungs in Aamjiwnaang Breathing the Most Polluted Air in Canada.” VICE United States. <http://www.vice.com/read/i-left-my-lungs-in-aamjiwnaang-000300-v20n8>. 21 Jan. 2014.
Industrial designer Ellena Lawrence is a huge sci-fi fan that proves that the air we breathe is as important as the world in which we immerse ourselves into.